In the production overview you are given an overview of the current state of your production. The displayed data are updated after each cycle.
You can select the machines, machine groups or halls, for which you want to see data, from a selection tree.
Double click on a line to display the 'Events list' of the respective machine.
|
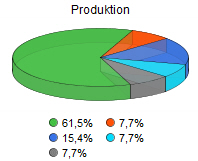
Underneath the selection tree a pie chart is displayed showing an overview of the operating modes in which the machines are operating. |
The following extract from the machine status is displayed:
Machine designation
S and ST identify the current operating mode of the machine. In S, 'P' stands for 'Production', 'M' for 'Manual', 'A' for Alarm' and O' for 'Offline'. In the ST column, the operating modes are identified by colours: ('green' - production; 'blue' - manual; 'red' - alarm; 'grey' - switched off).
Order status in percentage of completion. The coloured designation stands for the period up to the completion of the order. 'Green' indicates that the configurable warning area, which is 3 hours as a standard, has not yet been reached. 'Yellow' warns that the remaining run time is less than the time specified in the warning area. 'Red' indicates the end of the order.
Order designation
Program designation
Mould designation
Nominal quantity
Actual quantity
Actual Cavity
Cycle time
Time left
For the machine valid Shift no.: Break