Performance indicators are figures used for the quantitavely reproducible measurement of a process. They cover the following important aspects:
Information acquisition
Problem recognition
Control (nominal/actual comparison)
Documentation
Coordination (reaction control)
When computing performance indicators, the ALS system uses the information issued by the German Engineering Federation VDMA, standard sheet 66412-1 'Manufacturing Execution Systems (MES) indicator figures' as a basis..
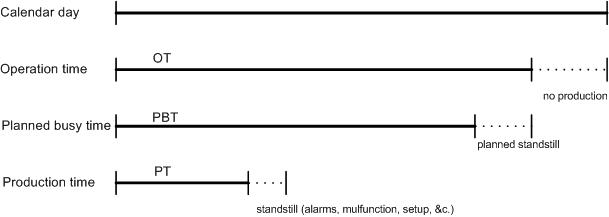
To calculate the indicators the following time model is used for the production units:
In ALS you will find the following performance indicators:
Availability - The availability is the relation of the "actual production time" to the "planned production time", i.e. the time assigned to a certain production order in the plan table. It thus reflects the utilisation of the capacity within a certain time period. The Plan assignment time comprises the time marked in the day model as the 'normal production time' minus the planned standstill time.
If you have defined no calendar, a plan assignment time of 24 hours per day is assumed.
Effectivity - The effectivity is the relation of the "nominal production time" to the "actual production time". It provides information on how effectively production was carried out within the 'Actual production time'. The nominal production time is hereby calculated from the actual production volume and the nominal part time. The nominal part time is calculated from the nominal cycle time and the nominal cavity count of the production order.
Quality rate - The quality rate is the relation of the good parts to the total parts produced.
OEE – Overall Equipment Effectiveness.The OEE is a measure of the degree of effectivity and is the product of availability, effectivity and quality rate.
Note: The availability and the OEE are "capped" in ALS to 100% as standard.
In the Reports module you will find performance indicators for the machines in relation to the current time periods, i.e. shift, day, week, month and year. Each report covers the following:
Performance figures (in relation to the selected time period and the selected machines)
Detailed performance figures in relation to the selected time unit or resources
Standstill times according to production resources account
Top 10 causes of error
Top 5 alarms
In the detailed view, the values can be displayed with regard to the time unit  or the selected resources
  anzeigbar. By clicking on the
  button you access the 'Status' report, which shows how long the resources were in the various operating modes in the selected time period. When you move the cursor over the diagram, it changes from an arrow to a hand symbol. Left-click e.g. on a calendar week to go to the next level of detail, here 'Day'.
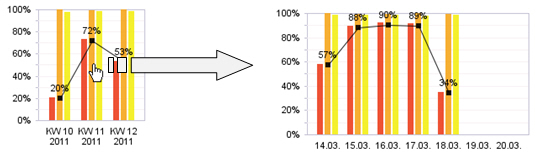
In this way you can quickly find out which events influenced the performance indicators the most. Likewise in the other diagrams you can also access the next highest level of detail by clicking on the bars.
With the  arrow keys in the icon bar, you can page backwards and forwards through
the opened reports.
arrow keys in the icon bar, you can page backwards and forwards through
the opened reports.
With  you open a further tab and can thus have several evaluations open parallel.