The process data acquired in 'Machine status' are made available in ALS for further processing. In the 'Quality assurance' module ( QS) you will find the functions for the configuration of the data acquisition and to display the values.
| The inspection orders in ALS are machine-related. The values of the last 100 shots (maximum) which have been recorded for the QS are displayed and evaluated per machine. The 'QS status indicators '
under the machine symbols in the machine hall become 'red', when the tolerance of a parameter was exceeded in the last random sample. The indicators turn to 'amber' when a tolerance was exceeded during the last 100 shots. 'Pale
grey' signalises that insufficient values have been recorded for the automatic evaluation of nominal values and tolerances. 'Dark grey' means that the inspection order has not yet been started. |
The data of the inspection orders and process data can be exported for archiving and further statistical evaluation. The standard directory in which these data are filed is 'DATA\QDA'. The format used for this file is usually the format used for exchanging data with the 'ARBURG Quality Assurance System' (AQS).
The tab in the window of the 'Quality assurance' module contains the page with the list of 'active inspection orders', the list of 'Inspection plans' and pages, on which the values of the active inspection orders are displayed in schematic form.
| To Start the recording of process parameters of a machine change to the 'active inspection orders' page and open the respective dialog with the 'Start QS' button. | |
| You now have the option of selecting an existing 'Inspection plan' and generating an inspection order from it or, after selecting the machine, of creating an inspection order manually. If the specifications you have input for an inspection order have proven to be favourable you can generate an inspection plan from the order. |
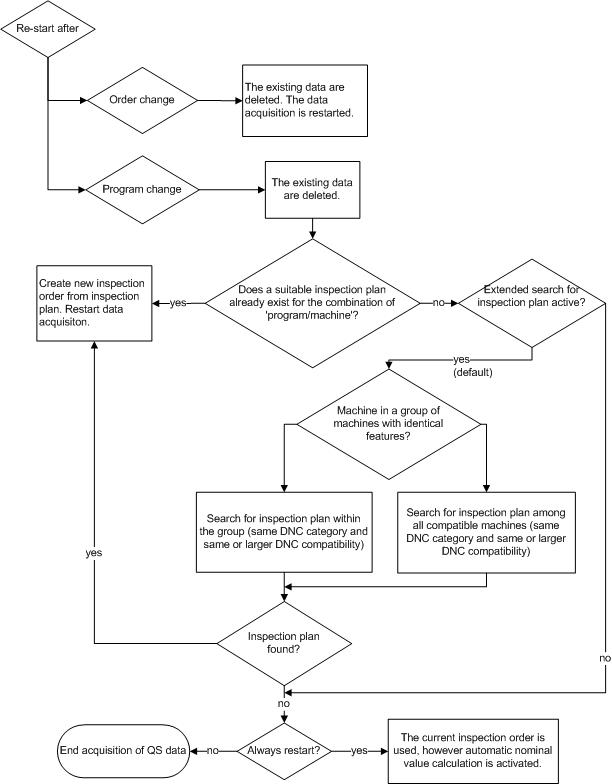
In the function group 'Quality assurance' you specify what is to happen when the designations of the order or program on the machine are changed. If you select 'restart with' the system will erase the previously recorded data. If the order designation changes, the data acquisition starts again. When the program designation is changed, an inspection plan is looked for, which matches the combination of 'Machine' and 'Program designation'. If an inspection plan exists, an inspection order is generated and the protocol function (logging) restarted.
The standard configuration of the ALS is designed so that when no inspection plan is available in the required ‘Machine/program’ combination, an inspection plan is looked for with the combination 'Program/compatible machine'. If no inspection plan exists for this combination the current inspection plan is used, the recorded data deleted and the nominal values automatically calculated.
If 'end with' has been selected, no further data are recorded when the designation is changed.
To display the data in ALS and to export the data, the number of random samples taken and the intervals between them can be selected separately. Up to 10 of the process parameters displayed in the machine status can be selected. You input the nominal value and tolerances or each parameter on the ‘Nominal specifications’ page.
If the machine is the 'Automatic' status, you can take the nominal values direct from the status. The function ‘Automatic calculation of nominal values’ is available for determining the tolerances. If this function is activated, the mean values of the next 20 shots are determined and these are used as nominal values. The tolerances are assumed as plus/minus 5% - 20% of this value, depending on the type of parameter.
| To end the recording of quality data on a machine, select the respective inspection order from the list and activate the 'End inspection order' button. |
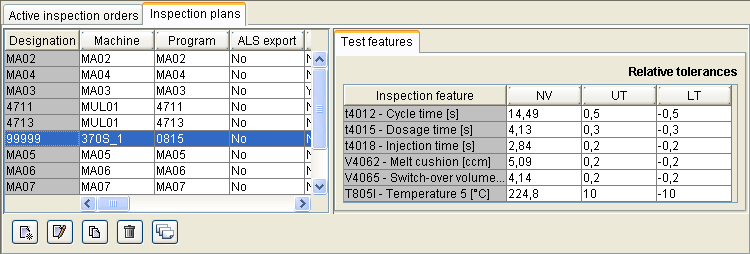
On the ‘Inspection plans’ page you will the functions for administrating the inspection plans. These include the 'Create', 'Edit', 'Copy' and 'Delete' the inspection plans.
To create an inspection plan the same input boxes are available as for creating an inspection plan. Here however you also specify the designation of the inspection plan and the program applicable to the plan.
With the ‘copy’ function you generate the basis for a new inspection plan.
Important: The inspection plan designator and the combination of machine and program can only be used once. ![]()
|
To display the QS graphics select the required machine in the 'QS list' and click on the button 'display graphics'. The process data are displayed in a line diagram (measured value chart). Draw the mouse indicator slowly over a measuring point to display the respective values. |
|
| By double clicking with the left mouse key on the diagram overview the diagram zooms in to the whole module window. A further double click on the heading zooms the diagram out again. You can achieve the same effect by clicking on the icons with the magnifying glass and then on the diagram. | |
| To initiate the print-out of the diagrams, click on the icon 'Print graphic'. | |
| To close a graphics page, click on the icon 'Close graphic'. | |
| Via the 'Actual value table' icon you gain access to a table in which the QS data are displayed. |
The display of the QS actual values is compiled of the calculated statistical variables and the actual measured values. For the headings of the columns you can use either the parameter designations used on the machines (e.g. t4012) or the actual designation (e.g. cycle time).
The statistical variables are compiled of the following factors:
| Size | Description |
| Lower tolerance | |
| Upper tolerance | |
| Minimum | Minimum value |
| Maximum | Maximum value |
| cp | Process capability |
| cpu | Process capability top |
| cpo | Process capability bottom |
| cpk | Process capability coefficient = minimum(cpu, cpo) |
| xq | Average of all value |
| xqq | Average of mean values |
| sq | Average of standard deviations |
| s | Standard deviation |
| UCLx | Upper control limit for the mean value of random samples |
| LCLx | Lower control limit for the mean value of random samples |
| UCLs | Upper control limit for the standard deviation |
| LCLs | Lower control limit for the standard deviation |
| n | Number of random samples |
| The values in the table can be exported in CSV format. | |
| The position and size of the window, type of column header and path for exporting the data can be saved via the icon with the 'Diskette' symbol. | |
| Transfer parameters to Microsoft Excel - the selected table is displayed in MS Excel and can be edited there. | |
| To print out the two tables on a printer, select between the 'Statistical dimensions' and 'Measured values'. |