In the 'Progression' module you will find an overview of the Production progression . The operating mode changes of the machines can be seen in colour-coded time bars. Information is available for each 'time period'. Furthermore, a detailed view can be opened for each machine.
![]()
![]() In the selection
dialog of the module, you limit the amount of data displayed via the machine selection and the display period. If you have not yet undertaken any changes to the display
of the module, the 'current selection of the (module) machine hall' will be used for displaying the machine. If you select one of the other selection criteria ('free choice' or (machines of a) 'hall'), and activate the function
"Save settings" in the 'Module' menu, this criteria will be suggested again when you next start the module.
In the selection
dialog of the module, you limit the amount of data displayed via the machine selection and the display period. If you have not yet undertaken any changes to the display
of the module, the 'current selection of the (module) machine hall' will be used for displaying the machine. If you select one of the other selection criteria ('free choice' or (machines of a) 'hall'), and activate the function
"Save settings" in the 'Module' menu, this criteria will be suggested again when you next start the module.
![]() For the 'free choice' of the machines, the dialog 'extended selection'
is available (see 'machine selection').
For the 'free choice' of the machines, the dialog 'extended selection'
is available (see 'machine selection').
The progression display consists of the 'machine list' and a graphics window with the time bars for the machines. The following colour codes are used for the time bars:
| black | unknown operating mode (initial) |
| white | not protocolled |
| grey | machine is switched off |
| blue | manual mode |
| red | machine has an alarm |
| green | machine is in production |
| yellow | machine is in production, but quality monitoring at the machine is deactivated |
| If you position the mouse cursor in the time scale the cursor changes to a magnifying glass with plus sign. When you click into the scale with the 'left mouse key', the display of the time period is reduced. To increase the display use the 'Shift' key and the 'left mouse key' in the time scale. |
If you pull the mouse cursor over a Time section of a time bar, associated information is displayed. With a 'double click' on a time section, an 'Info' window is opened.
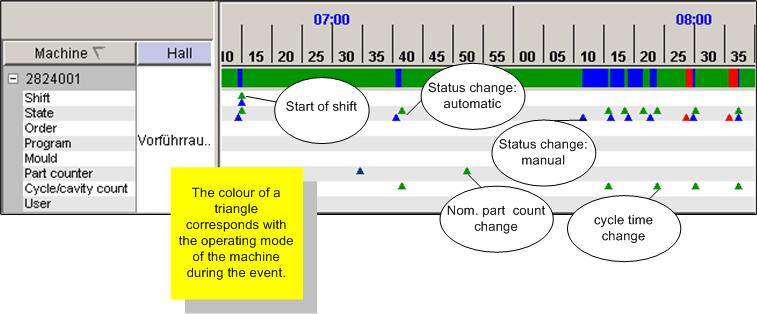
![]() To display details of the production progression of a machine, click on the '+' sign to the left of the machine designation. Under the time bar additional lines are now displayed. Small triangles in these additional lines mark certain events. The colour of a triangle corresponds with the operating mode of the machine during
the event. The following events are displayed:
To display details of the production progression of a machine, click on the '+' sign to the left of the machine designation. Under the time bar additional lines are now displayed. Small triangles in these additional lines mark certain events. The colour of a triangle corresponds with the operating mode of the machine during
the event. The following events are displayed:
| Event class | upper part of time bar |
| lower part of time bar | |
| Shift | start of shift / start of break |
| end of shift / end of break | |
| State | change of state to automatic |
| change of state to 'manual' / red - after 'Alarm' / black - unknown state | |
| Order | order logged on |
| order logged off | |
| Program | program logged on |
| program logged off | |
| Mould | mould logged on |
| mould logged off | |
| Part counter | good part counter reset / book parts/time |
| bad part counter reset | |
| Cycle/cavities | change of cycle time |
| change of no. of cavities | |
| User/worker | User has entered an event. Worker logged-on at machine. |
| Worker logged-off at machine. |
By double clicking on a 'triangle' you will receive detailed information.
When you right-click on an event, a PopUp menu is displayed, which contains the functions for displaying the Events list, for Commenting on an event, or deleting a Comment.