The process data stored in 'Machine status' are used for further processing by ALS. In the 'Quality assurance' module you will find the functions for configuring the data acquisition and for displaying the values.
On opening the module you see a register with the tabs 'active inspection orders', 'inspection plans' and others with machine names.
Under 'active inspection orders' you will find a list of machines for which the acquisition of process data has been started. The 'Status' of an inspection order can display the following statuses:
![]() Inspection order is dormant - the program designation has been changed and there is no matching inspection plan.
Inspection order is dormant - the program designation has been changed and there is no matching inspection plan.
![]() no data available yet for the automatic recording of nominal values and tolerances
no data available yet for the automatic recording of nominal values and tolerances
![]() inspection order not yet started
inspection order not yet started
![]() the values of the last 100 shots were in tolerance
the values of the last 100 shots were in tolerance
![]() some values in the last 100 shots were out of tolerance
some values in the last 100 shots were out of tolerance
![]() the data of the last shot were out of tolerance
the data of the last shot were out of tolerance
 Run/ Trend/ Control Limits
 Inspection Order completed
In the 'Machine hall' you will find this status symbolised by a rectangle, in the same colour code, on the left under the machine name.
Via the 'right mouse button' you access the functions:
end QS
change QS
display graphics
![]() To generate an inspection plan from an inspection order - only the designation of the inspection plan need be specified.
To generate an inspection plan from an inspection order - only the designation of the inspection plan need be specified.
In the frame of the client at the bottom centre, the number of list entries and the timestamp of the list update is displayed.
![]() If you want to view the exported actual values and data of the inspection order, without processing them with another system,
the QS module offers you a viewer.
If you want to view the exported actual values and data of the inspection order, without processing them with another system,
the QS module offers you a viewer.
Note: If you have opened the QS module in an individual window, you should 'pin' it in the foreground before you use the functions of the modules. Otherwise it will disappear into the background, when you, for example, start the 'QS’ dialog.
When you open the 'quality assurance' module you will find an additional symbol bar under the 'list'.
![]()
With the symbol on the far left you start the quality data acquisition. With the next symbol you end the data acquisition. The next symbols are for 'Change QS'
and for 'Display graphics'. With the last button you generate an inspection plan from an inspection order. When you generate an inspection order from an inspection plan however, you can take over the
changes you have made in the inspection order into the inspection plan with ![]() .
.
Click on the symbol for 'start QS'.
In the dialog 'Start quality assurance' you first select either an inspection plan or a machine from the 'Settings' page. If an inspection plan exists for the combination of mould, program and machine, you must only check the existing data and then start the data recording.
In the 'extended search for an inspection plan' ![]() a special
combination field will be of assistance in finding the matching inspection plan. When you enter the first characters of the name you are looking for, all matching entries are displayed. Character groups can be masked with the place holder '
*'.
a special
combination field will be of assistance in finding the matching inspection plan. When you enter the first characters of the name you are looking for, all matching entries are displayed. Character groups can be masked with the place holder '
*'.
If no inspection plan exists, generate an inspection plan or enter data for an inspection order from which you can later generate an inspection plan.
If an inspection plan already exists for another machine, use this inspection plan as a basis for the current machine, i.e. you adapt the nominal values.
To add an inspection order, proceed in the following order:
After selecting the machine, specify when the quality data acquisition is to be ended or restarted.
If the recorded data are to processed further by an external system, activate the functions for 'Export' of the inspection order data (order designation, program designation etc.) and the actual values.
Select the values for the number of random samples to be taken and intervals in between. The units 'Parts', 'Shots' or 'Minutes' are available
for counting the random sample intervals.
If you want to document all shots (100% check), select e.g. a random sample count of 5 pieces and an interval of 5 shots because the interval relates to the beginning of the previous random sample lot. Random sample lots under a count of 5 do not provide reliable statistical information.
For the data export you have the possibility of making special specifications for the random sample intervals and quantities.
In the 'Parameter' page you can now select the process parameters suitable for the items to be produced. A maximum of 10 parameters can be selected.
Note: with ARBURG machines with a SELOGICA controller, the display of cavity pressure 1 and cavity pressure 2 depends on whether meas. system 1 / meas. system 2 is active in the controller.
Now change to the page 'Nominal specifications'. Here you determine the nominal values and tolerances. To do this, left click into the respective input box.
If you have activated 'Automatic determination of nominal specifications' the specifications will be calculated from the next 20 shots. The tolerances are assumed as plus/minus 5% - 20% of this value, depending on the type of parameter.
Alternatively, the current actual values can be taken over from the machine status as nominal values via the button ![]() , whereby
you then specify the tolerances yourself.
, whereby
you then specify the tolerances yourself.
In the list of 'inspection plans' you see the features of a selected inspection plan in the right-hand window. The list supplies the functions to
![]() add
add
![]() change
change
inspection plans.
An inspection plan is defined for the combination of 'Machine / Program'. The dialog 'Add an inspection plan' comprises the same pages as that of defining an inspection order (see above).
Note: the inspection plan designation and the combination of machine and program can only be used once. ![]()
![]() To display the QS graphics select the required machine
in the 'QS list' and click on the 'display graphics' icon.
To display the QS graphics select the required machine
in the 'QS list' and click on the 'display graphics' icon.
The process data are displayed in a line diagram (measured value chart). When you move the mouse indicator slowly over a measuring point, the associated values are displayed. (value / quantity / random sample counter within the random sample batch / date and time of documentation)
A double click with the left mouse button on the diagram heading will enlarge the diagram to the full module window. A second double click on the heading reduces it again. You can achieve the same affect by clicking on the magnifying glass icon at the top right corner of each diagram.
![]() 'Change graphic settings':
'Change graphic settings':
For the designation of the horizontal axis you can select either the 'random sample number', the 'count' or the 'time' of the random sample. For scaling the vertical axis of the measured value chart, the options 'automatic (via tolerance range)' and 'minimum-maximum' can be selected. With 'minimum-maximum' the spreading of the axis depends on the smallest and largest value of the acquired dimension.
You can display the data in the form of a 'measured value chart' (individual values) or as a 'control chart', with separate diagrams for the mean values
and standard deviations of the random samples.
![]() You can save the changes made in the 'Graphic settings', so that the graphics are displayed
in the same way when the module is opened again.
You can save the changes made in the 'Graphic settings', so that the graphics are displayed
in the same way when the module is opened again.
![]() Click on this symbol 'print graphics' (underneath the diagrams) to print out the diagrams
on your printer.
Click on this symbol 'print graphics' (underneath the diagrams) to print out the diagrams
on your printer.
![]() Actual value table, displays
the data in table form.
Actual value table, displays
the data in table form.
![]() Close a graphic page by clicking on the 'close graphic' icon.
Close a graphic page by clicking on the 'close graphic' icon.
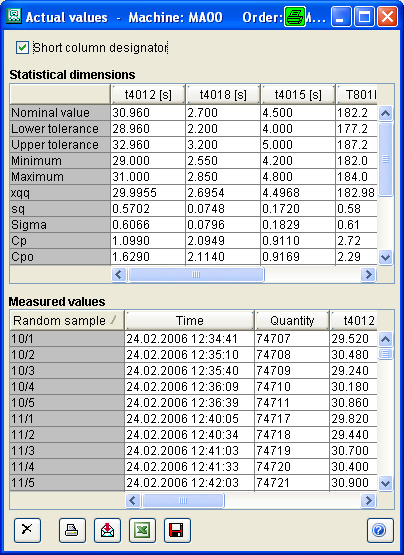
In the actual values table you will find nominal values, tolerances and statistical values in the upper section and the actual measured values in the lower section.
Used terms:
|
Nominal value |
given specification |
|
Lower tolerance |
lower specification limit |
|
Upper tolerance |
upper specification limit |
|
Minimum |
lowest value which appears |
|
Maximum |
biggest value which appears |
|
xqq |
average value of the test samples average |
|
sq |
average value of the standard deviation of the test samples |
|
Sigma |
standard deviation of all values |
|
Cp |
capability index: measure for deviation of the process in relation to the specification. |
|
Cpo |
capability index in relation to the inputted upper tolerance limit. |
|
Cpu |
capability index in relation to the inputted lower tolerance limit. |
|
Cpk |
capability index: meaure for deviation and position of process in relation to the specification |
|
UCLx |
upper control limit of measured values |
|
LCLx |
lower control limit of measured values |
|
UCLs |
upper control limit of standard deviation of test samples |
|
LCLs |
lower control limit of standard deviation of test samples |
|
n |
count of measured values |
![]() You can print the upper or lower section. The table is printed as displayed i.e. if you fade out a column in the display, it is not printed.
You can print the upper or lower section. The table is printed as displayed i.e. if you fade out a column in the display, it is not printed.
![]() It is possible to export the data in CSV format (comma separated variable) so that they can be processed by other programs (e.g.
MS Excel).
It is possible to export the data in CSV format (comma separated variable) so that they can be processed by other programs (e.g.
MS Excel).
![]() Transfer parameters to Microsoft Excel - the selected table is displayed in MS Excel and can be edited there.
Transfer parameters to Microsoft Excel - the selected table is displayed in MS Excel and can be edited there.
![]() The changes made in the displayed lists (column width, column position) are saved by clicking on this symbol.
The changes made in the displayed lists (column width, column position) are saved by clicking on this symbol.
When the function for viewing exported QS data is activated, you first access the 'Inspection order selection'. Here you select the inspection orders with the data you want to see. This function is useful
because there are no further restrictions for the exported data other than the amount of space available on the drive. One inspection order can take up several lines in the list because a new data set is created each the quality data protocol function
is started. The protocol function restarts each time when, e.g. the nominal value or tolerances of a parameter are changed. The new data are displayed with a delay of max. 1 hour. Select the required inspection order from the list and display the
data by clicking on ![]() .
.
The data are displayed as shown in the Actual value table above.
Note:
In order for the exported actual values to be displayed, the check box next to "export" must be activated in the 'Inspection orders/actual values' frame in the 'start/edit QS' dialog.
With Microsoft Excel 2007 a maximum of 65,535 lines can be displayed. With Excel 2007 the limit is 1,000,000 lines.
You yourself are responsible for the administration of the exported data, i.e. suitable measures must be undertaken for saving and removing obsolete data. It is practical to export the data to a drive used only for this purpose. Then, when the capacity of this drive is full, no other programmes will be affected.
When you have configured the export of quality data, the ALS creates a new file every hour. If 100 machines are connected, this would mean that 8760 files are created every year. If such a large number of files were stored in a sub-directory, access to the directory would be slow. It is therefore advisable to remove the files from the directory at intervals of e.g. six or twelve months and to archive them. The entries in lists in the 'Inspection order selection' are never deleted. Therefore, when you reimport the files to the export directory, in order to view certain data, the ALS can access them directly. For this purpose, the file containing the start of the protocolling of the inspection order, must be available.